
Background
This article was inspired by an excellent article in Linux Format (LXF 248, February 2019, P. 58) entitled “Remote sensors” or “Sharing data from remote sensors”. Essentially that mini-project used the Raspberry Pi in conjunction with a DHT11 temperature and humidity sensor to log data to a file stored on Dropbox. The project as described worked well but in my opinion had a few limitations:
- As time went by, the file size uploaded to Dropbox increased and would eventually become rather slow and cumbersome. This also means that there is more likelihood of data loss caused by poor connections.
- The project only logged temperature and ignored the humidity reading – a waste of the capabilities of the DHT11. Humidity data could also be important if you are looking to implement some form of weather station or monitor in a humidity sensitive area such as a greenhouse. If you only want temperature readings it is easier (and cheaper) to use a DS180B20 1-wire device.
- No method of displaying the gathered data was presented except by loading the file into a Libre Office calc sheet each time. Again, there is nothing wrong with this, but some form of web based display might be more useful as it is accessible remotely.
- The data was stored as a simple csv file. This is not unusual but recording to a full blown SQL database would make the system much more flexible.
With the above in mind, I decided to develop a system of my own that:
- Minimises the uploading of data
- Saves the data locally with dropbox backup as well as in a remote SQL database
- Logs humidity as well as temperature
- Adds alarm levels when certain temperature limits are exceeded.
- Makes provision for controlling some form of heater switching.
- Sends alarm emails and/or SMS messages if temperatures are out of preset ranges.
The output from my revised and extended system can be seen here (1 day’s data), or here (long term data, takes a while to load).
Hardware
The diagram below shows the basic datalogger connection diagram.
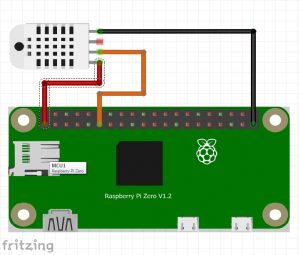
Datalogger basic connections.
The original article used a DHT11 sensor. My project uses a DHT22 4 pin sensor which is slightly more accurate and worked with the exact same code as the original.
DHT22 Pin 1 connects to Pi pin 1 (3v3)
DHT22 Pin 2 connects to Pi pin 11 (GPIO17)
DHT22 Pin 4 connects to Pi pin 39 (Ground/0v)
The (Python) Code for the Basic System
All the code in this project assumes that you are using a recent version of Raspbian. To install the necessary Python libraries, first make sure that you are up to date:$ sudo apt-get update
$ sudo apt-get upgrade
Then install:$ sudo pip3 install Adafruit DHT
$ sudo pip3 install dropbox
In order to use the dropbox facility it is necessary to set up a dropbox account, set up an app and get an access token. This can be obtained by going to your dropbox account and selecting developers – www.dropbox.com/developers – the “Create your App” using the dropbox API, for access use “App Folder” and name your app, we will use “Pi log”. Create the app and go to the final screen where you will find you can generate an access token of the form “fU-2TIyyyfUBBBBBBBBCme2mCZpuu5GZZAVRm6soHH6fsYJ1CG6uyrvm-orxxe8Z”, make a note of this but make sure that you keep it secret – it is the key that opens the dropbox!
If you want to send email alert messages you need to install ssmtp and mailutils as well:$ sudo apt-get install ssmtp
$ sudo apt-get install mailutils
You will need to edit the /etc/ssmtp/ssmtp.conf file to enter your own email details. An excellent ‘how to’ is here: https://raspberry-projects.com/pi/software_utilities/email/ssmtp-to-send-emails. Adjust the settings according to your email address, hostname etc. and test that it works using the command line as in the how to.
At this point you should test that all is well. Open a new file with your favourite python3 editor (I use idle3 as it allows you to test code as you develop it) and enter the following code:
import Adafruit_DHT,datetime,dropbox
#next import line will be used later
import urllib.request,urllib.parse
#note change of sensor type
sensor=Adafruit_DHT.DHT22#set gpio pin for sensor
gpio=17
#read the values - note both temperature and humidity
humidity, temperature=Adafruit_DHT.read_retry(sensor,gpio)
timestamp=datetime.datetime.now()
#fix timestamp to something useful
timestamp=str(timestamp.strftime("%Y-%m-%d %H:%M"))
#fix the values read to truncate 1 decimal place and make into string
temp=str("{0:0.1f}".format(temperature))
hum=str("{0:0.1f}".format(humidity))
#make a log entry string
thdata=str(timestamp+","+temp+","+hum+"\n")
print (thdata)
#uncomment the next section if you want to "POST" values
#to a remote site
#readings={'tstamp' : timestamp, 'temperature' : temp, 'humidity' : hum}
#data=urllib.parse.urlencode(readings)
#data=data.encode('utf-8')
#requ=urllib.request.Request(url,data)
#response=urllib.request.urlopen(requ)
#responseData=response.read()
#print (responseData)
#end of POST to remote site
#Save the data to a local file
df=open("/home/pi//thdata.csv","a")
df.write(thdata+"\n")
df.close()
#now send to dropbox if you want to, substitute your token!
token="fU-2XXXXXXXXXXXXXXXXXXXXXZZZZZZZZZZZZZZZZZZ"
dbx=dropbox.Dropbox(token)
with open("/home/pi/thdata.csv","rb") as data:
dbx.files_upload(data.read(),'/thdata.csv',mute=True,
mode=dropbox.files.WriteMode.overwrite)
To test the code, save the file as pithlog.py and open a terminal window and make the file executable:
and run the script:
You should see one line of output with the date, time and readings. Check your dropbox folder online to make sure that the data has arrived.
The final step in part 1 is to make the script run at regular intervals using cron. At a terminal prompt edit crontab:
and at the end of the file add the line:
Make sure that there is a newline at the end of the file. You may also optionally add this line before the one above if you want email notifications if there are errors, useful if dropbox does not work:
If you do not want to see any normal output, comment out any print statements used for debugging.
If you have successfully got this far Congratulations!
In the next part I will show how to POST the data to a remote site and display it in a chart. Coming soon.